How AI Is Transforming External Car Defect Detection for Automotive Businesses
5/5/20254 min read
Ending Manual Walkarounds: A Guide to Exterior Vehicle Defect Detection with Computer Vision
Manual inspections were built for a world of low volumes and patient customers. In high-throughput operations, they create variability, extend cycle times, and invite disputes. A computer-vision workflow replaces that friction with objective, photo-backed condition reports, 3D-aware severity measurements, and consistent standards across sites and shifts. Deployed correctly, organizations typically cut time per inspection by 70–90 percent, reduce disputes by 30–50 percent, and reach payback in a matter of weeks rather than quarters.
The business problem
Inconsistency is the dominant cost. Lighting changes, inspector fatigue, and site differences lead to contradictory condition reports that are hard to defend. A typical manual inspection consumes five to seven minutes and yields photos that lack structure, measurements, or traceability. When customers challenge a decision, your team is forced into subjective debate. Each dispute consumes support capacity, stalls vehicle handover, and erodes trust.
The solution in one view
A production-grade lane combines multi-view imaging, controlled lighting, and a two-branch vision stack. Vehicles pass through in motion while short, synchronized exposures capture images from several angles under polarized lighting. The system separates diffuse paint from specular reflections, reconstructs surface shape, detects defects, and reports measurable severities—dent depth in millimeters, scratch length along the actual curved surface, chip area in square millimeters or centimeters—together with cross-view confirmation and clear pass/fail outcomes aligned to your thresholds. Every result is timestamped, versioned, and exportable as JSON or a signed PDF.
How the system is built
Accuracy begins at capture. A horseshoe frame holds six to twelve cameras, with stereo pairs on the vehicle flanks and oblique views at the front and rear. Cross-polarized LED bars fire at multiple incident angles to suppress glare and reveal micro-geometry. A conveyor or turntable encoder triggers exposures so the vehicle appears frozen even while moving. Because the inputs are clean and repeatable, the downstream models spend their capacity on recognition rather than rescue.
The first processing stage normalizes the surface. The software splits each frame into diffuse and specular channels and applies intrinsic illumination correction to stabilize shading. On sequences captured under different light directions, a photometric-stereo pass recovers per-pixel surface normals; paired cameras produce dense stereo depth. These cues expose shallow dents that RGB alone often misses.
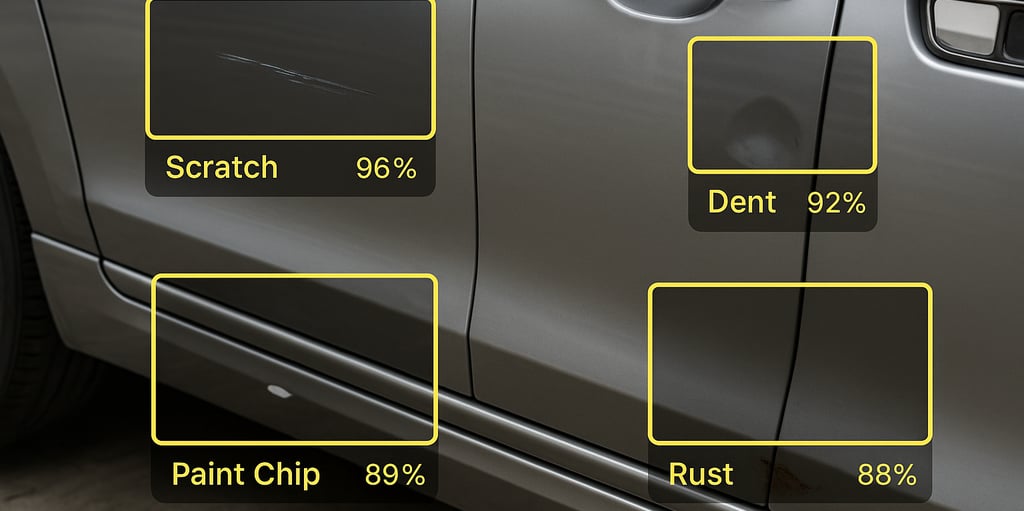
Perception then proceeds along two complementary tracks. A supervised detector—typically a multi-scale transformer—produces instance masks for dents, scratches, chips, and rust. Long, thin scratches are represented as polylines rather than boxes, which makes subsequent measurement reliable. In parallel, an unsupervised student-teacher network trained only on good panels generates an anomaly heatmap that highlights unknown or rare defects such as paint blemishes not present in the labeled set. A calibrated fusion stage blends the two outputs and enforces spatial consistency with a panel-graph conditional random field so that isolated speckles do not masquerade as damage.
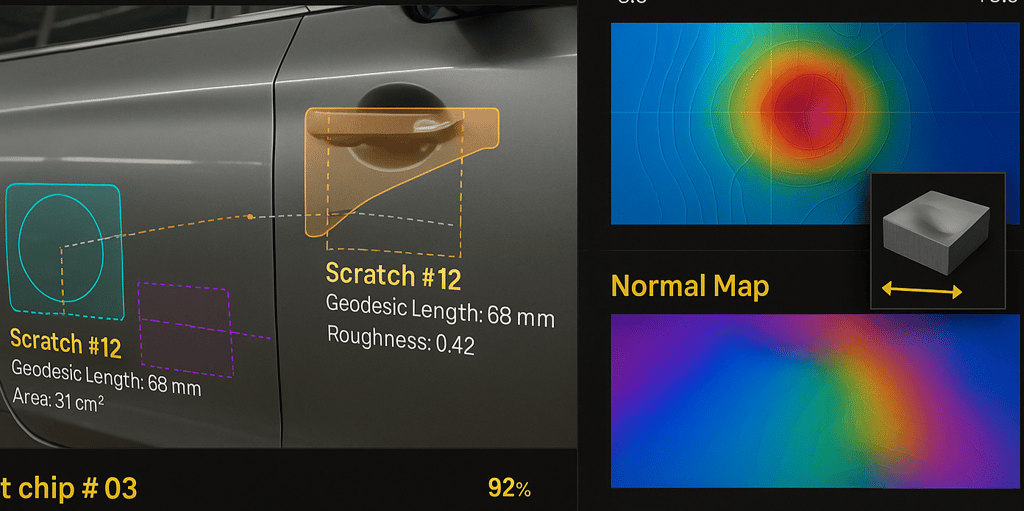
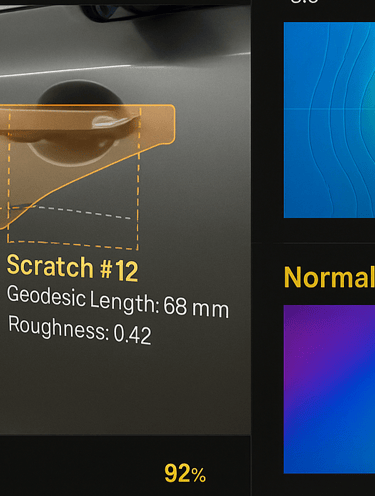
Severity is quantified in 3D rather than guessed from pixels. For dents, the system fits a quadratic patch to local normals and depth and reports peak deviation in millimeters together with affected area and curvature. For scratches, it skeletonizes the mask and computes geodesic length along the panel surface. For chips, it converts pixels to metric area using depth-aware solid angles and estimates bare-metal probability from texture and specular cues. These numbers are mapped to business rules—different panels can have different billable thresholds—so the output is not only a measurement but a decision you can act on.
False positives are suppressed by persistence. Detections are tracked across time as the vehicle moves and across viewpoints as different cameras observe the same location. Only findings that persist for several frames or appear in two or more views are promoted to confirmed status. The interface shows per-view agreement and triangulated position on a vehicle silhouette, which makes it obvious why a claim is being accepted or rejected.
Uncertainty is managed rather than ignored. Each defect carries a confidence score and a predictive-uncertainty estimate. Items above your thresholds are auto-approved; ambiguous cases are routed to a compact review screen where a human can accept or adjust with a single gesture. Those edits are logged and used for scheduled fine-tuning so the model adapts to site conditions without ceremony.
The reporting layer is designed for audits. Every inspection produces a consistent artifact: annotated images, measurements with units, the applicable threshold and policy outcome, the list of confirming cameras and frames, and a cryptographic hash so reports cannot be altered after the fact. APIs push the result into fleet, claims, or QA systems; a web dashboard supports spot checks and training.
Deployment options
Two practical models are common. On-premises edge inference uses a small GPU appliance mounted at the lane; models are quantized for sub-200-millisecond latency per view and the system continues operating if the network blinks, syncing when connectivity returns. Cloud or hybrid deployments centralize model management and telemetry while honoring data-residency policies. In both cases, encryption in transit and at rest, role-based access control, audit logs, and configurable retention are standard.
Measuring impact and demonstrating ROI
Start with time per vehicle, lane throughput, recall at your business thresholds, false-positive rate per vehicle and panel, dispute rate and resolution time, and the share of inspections routed to human review. Converting these into savings is straightforward: multiply minutes saved per vehicle by volume and labor cost per minute; add avoidable dispute costs and any reduction in claims leakage. Compare the total to monthly operating cost and amortized hardware. Programs with moderate volumes routinely achieve payback inside one to two months; higher-volume sites close the loop faster.
Three visuals convey the value without technical deep dives. A multi-view cross-verification panel shows four angles agreeing on the same dent with a clear “confirmed by 4/6 cameras” badge. A 3D-aware severity panel pairs the original photo with a depth-deviation map and normal map and lists measured numbers that tie directly to policy. A paint-chip risk view illustrates area, proximity to panel edges, and bare-metal probability alongside a risk gauge. Together they translate vision science into operational decisions.
Exterior defect detection does not need to be a judgment call. With disciplined capture, robust perception, and 3D-aware measurement, inspections become standardized, measurable, and auditable. The effect is felt in faster lanes, fewer disputes, and cleaner books. If your operation handles vehicles at scale, the most efficient path forward is a contained pilot at one lane using your thresholds and reporting requirements. We will provide the rig plan, integrations, and the ROI pack that allows leadership to decide with confidence. Reach us at info@polarlume.com with the subject AI Inspection Pilot to schedule a demonstration tailored to your volumes and environment.
Polarlume
Transforming industries with tailored algorithmic solutions.
Automation
info@polarlume.com
© 2025. All rights reserved.